User Manual
Overview
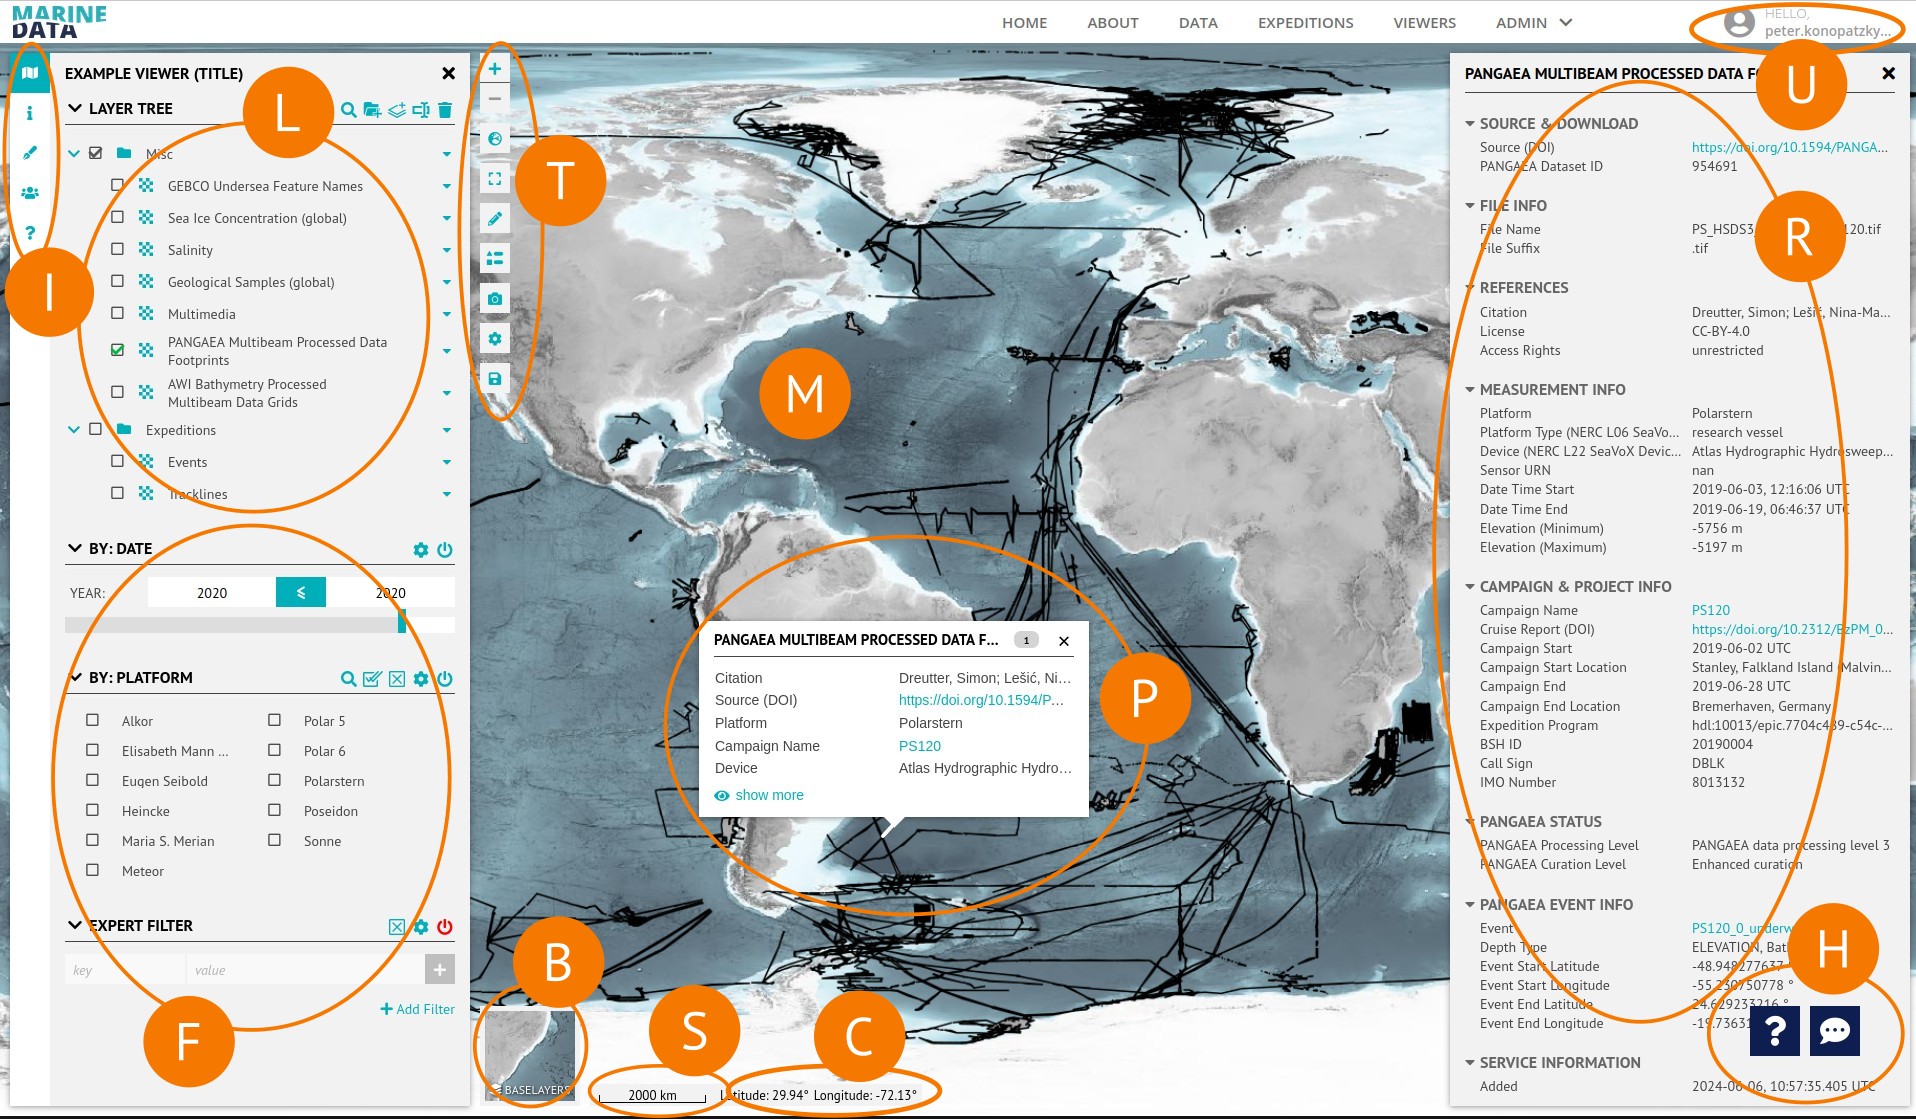
A viewer consists of multiple elements. The most important are the map (M) and the left sidebar containing the layer tree (L) and filter widgets (F). These are complemented by tabs with additional information (I), tools (T), a baselayer switch (B), scale (S) and position (C) information and a help/support section (H).
Screenshots in this tutorial are created using viewers in the Marine Data portal. Viewers in other portals might have differently coloured elements (e.g. buttons).
| Mark | Element | Description |
|---|---|---|
| U | User/Login | Shows either a login button or the logged-in user. Only logged-in users can save edits to viewers. |
| M | Map | Shows the chosen background map. If any layers are activated in the layer tree (L) it also shows their content, respecting the activated filters (F). |
| L | Layer Tree | A structured list of layers. |
| F | Filter Widgets | List of widgets to filter the content of the layers selected in the layer tree. |
| I | Information Tabs | Click to switch between the map tab (layer tree and filter widgets), the information tab (viewer abstract/description ), the contributors tab (viewer authors, credits) and the help tab (documentation, key bindings). |
| T | Tools/Toolbar | Tools to zoom, switch view/projection (arctic, antarctic, global), add/draw geometries, show a legend, take a screenshot and save the current state (only works logged-in). |
| P | Popups | Opens when clicking on data shown on the map. Displays some information about the data. |
| R | Right Sidebar | Opens when clicking on "Show more" in a popup or "Information" in a layer's context menu. Displays more metadata or information, depending on the context. |
| B | Baselayer Switch | Offers a selection of background maps. |
| S | Scale | Shows the scale of the map. Accuracy depends on the projection used. |
| C | Coordinates/Position | Shows the coordinates (in EPSG:4326) of the position of the mouse cursor. Click it change the coordinate representation. |
| H | Help |
|
Map Tools
Baselayer Switch
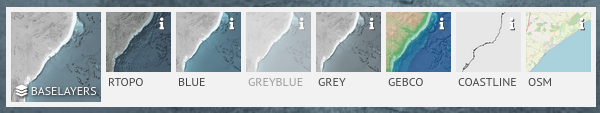
Use the baselayers switch in the bottom left corner of the map canvas to select one of the available baselayers. While there are several baserlayer options, not all of them are available for every perspective or projection.
Toolbar
Zoom


The plus/minus buttons are used to zoom in and out, while the bracketed square is used to zoom to the full extent.
'Full extent' refers to zooming in so that all the content from all the selected and activated layers is visible. However, this does not take into account the effect of filters, so the result usually depends on the quality of the bounding box data for the layers.
View/Perspective
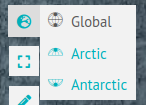
The globe button can be used to switch perspectives. Three perspectives are available: global, Arctic and Antarctic. These perspectives use different coordinate reference systems. The defaults are EPSG:3031 for the Antarctic, EPSG:3995 for the Arctic and EPSG:4326 for the global view.
TIP
- If one or more of the perspectives is greyed out, this may be because the chosen baselayer does not support the corresponding coordinate reference system(s).
- The same applies to layers that do not support the coordinate reference system used by the selected perspective.
Drawing Tools
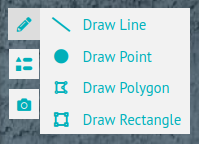
The pencil button and related drawing tools allow you to add points, lines and polygons, as well as metadata, to the map. The result can be saved as a GeoJSON file — there is no other option for saving it.
Legend

The list button opens a pop-up displaying the legends of all selected layers. This can be opened alongside layer-specific legend pop-ups.
Screenshot

Takes a screenshot of the map canvas, adds the portal logo and downloads the result as viewer.png. It also hides all other UI elements on the screenshot.
Configuration, Save

The gear and floppy buttons only appear when the user is logged in.
They open a configuration dialogue that allows you to edit the viewer's metadata, change various settings and save the current state of the viewer, either overwriting the existing viewer or creating a new one.
For more information on how to use it, see the creator manual.
Left Sidebar
The left sidebar comprises up to four tabs: Map, Information, Contributors and Help.
Map Tab
Contains the Layer Tree widget and Filter widgets.
All widgets can have one or more colored icons next to their title, which are called tools. Number and type of tools depend on the widget type and the widget's configuration. They will be explained either below or in the Creator Manual. Widgets can also be collapsed using the the arrow symbol left to their title.
Layers
- Layers at the top of the Layer Tree are displayed on top of the map, potentially covering other layers. However, certain layer types (e.g. from files or services like NRT and STA) are always rendered on top.
- The map design can be changed by reordering the layers via drag & drop.
- Context menus can be accessed by either right-clicking or clicking the triangle icon.
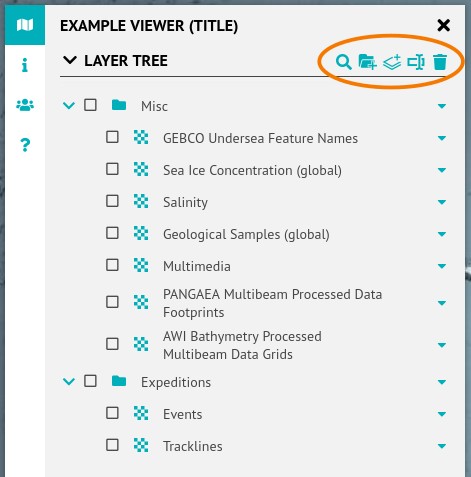
Tools
The Layer Tree Tools Bar (marked in orange) offers a variety of tools. However, any changes made will be temporary and will not be saved unless the Save button is clicked (only works logged-in). Screenshots of the map can be taken using the Camera widget And layers/folders can be added or removed.
Filters
Filter Widgets query the selected layer and return the available results. However, there are many layers, and their content varies. For example, some layers contain time information or additional variables, while others do not.
The presence of an exclamation mark next to a filter option indicates whether it can query this layer. There are several filter options, some of which can be configured by the viewer owner. Additonals can be added.
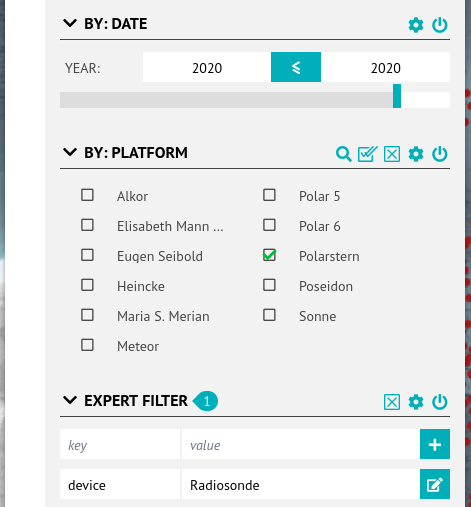
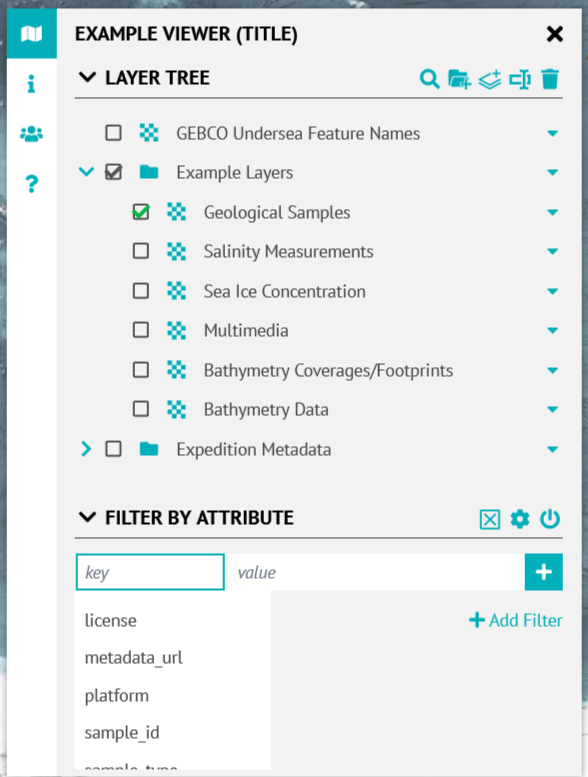
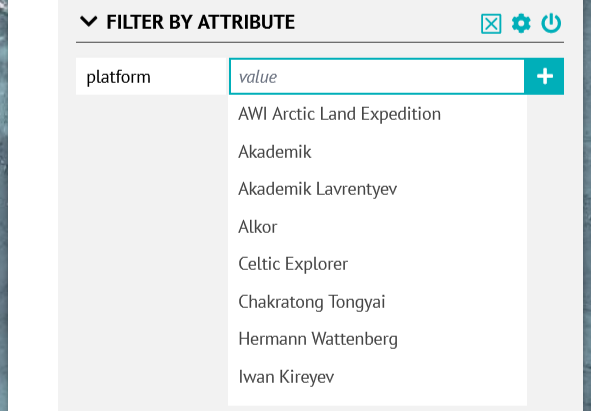
Key-Value
The key-value filter widget, often titled Filter by Attributes or Expert Filter, enables the user to freely choose which key (column/attribute) to be filtered for what value(s).
It offers auto-completion for both input fields, proposing all known keys and values from all layers (that support to get these information). However, you may type freely.
Bounding Box
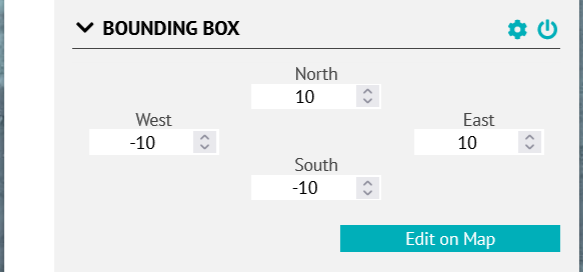
The coordinates of the bounding box rectangle can be entered in decimal degrees. Users can also enter real numbers using a decimal separator, either comma or point. This filter works with point data in global perspective. Its application in Arctic or Antartic perspective is not recommented, especially when covering the poles.
Information Tab
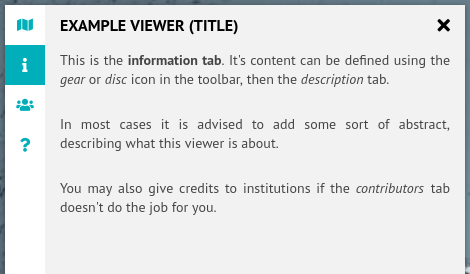
Provides further information or an abstract of the project/viewer, as well as information about how to cite it.
Contributors Tab
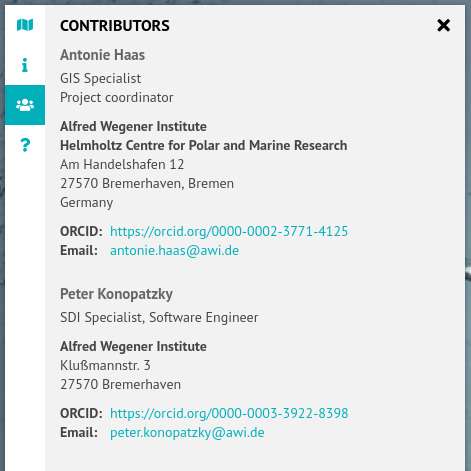
Lists all the authors or institutes that contributed to the project/viewer.
Help Tab
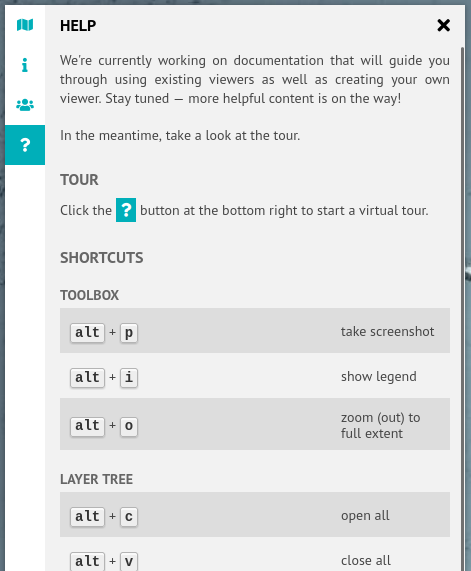
Provides more information about the viewer functionalities and how to use them. It also lists shortcuts to help navigate the viewer application.
Right Sidebar and Popups
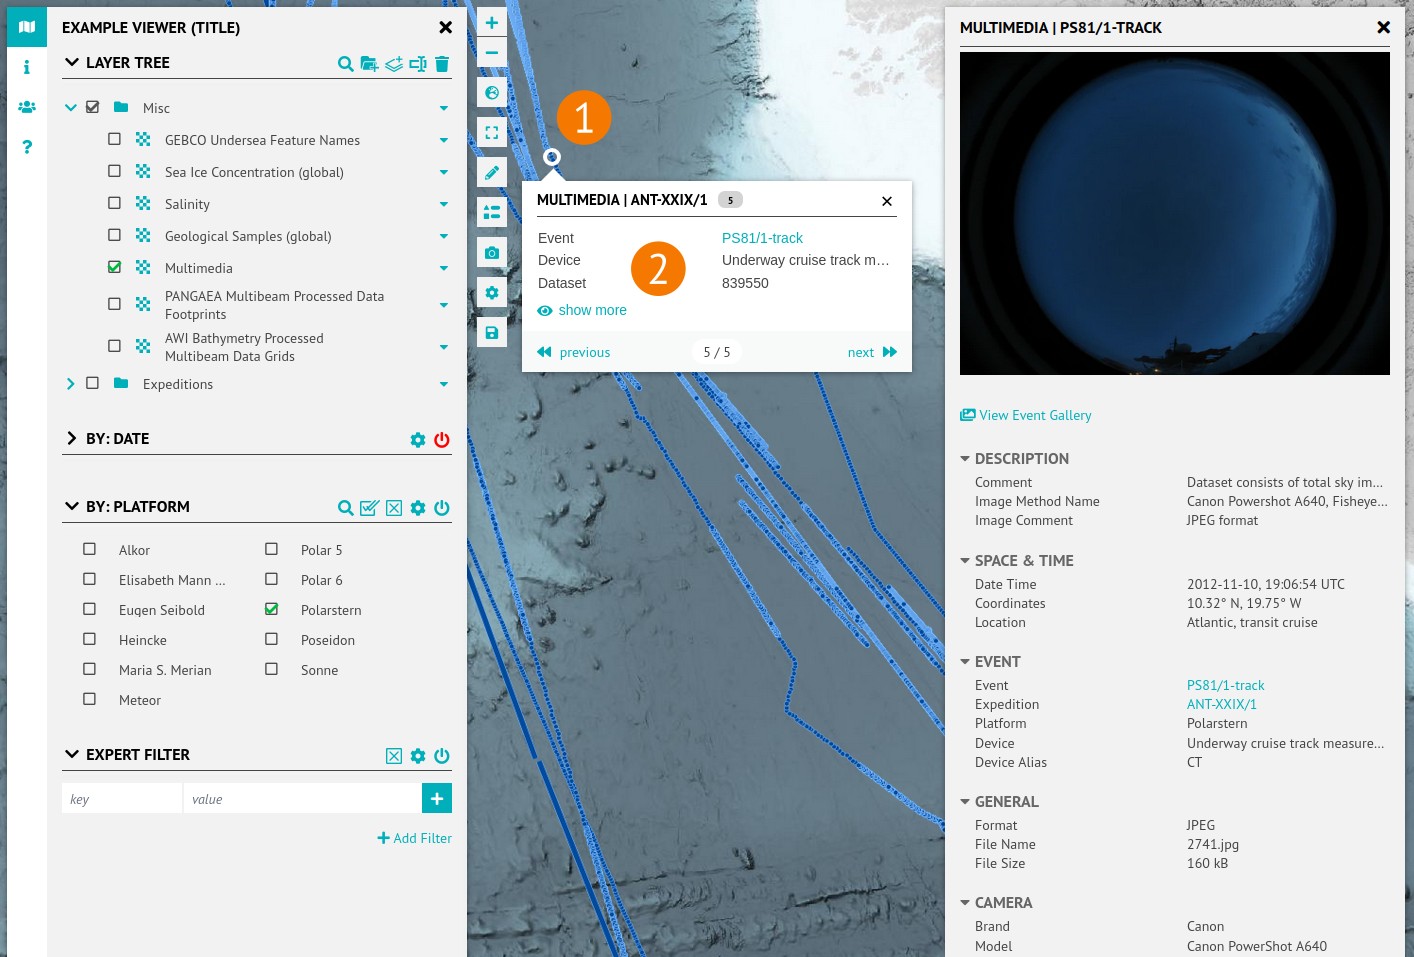
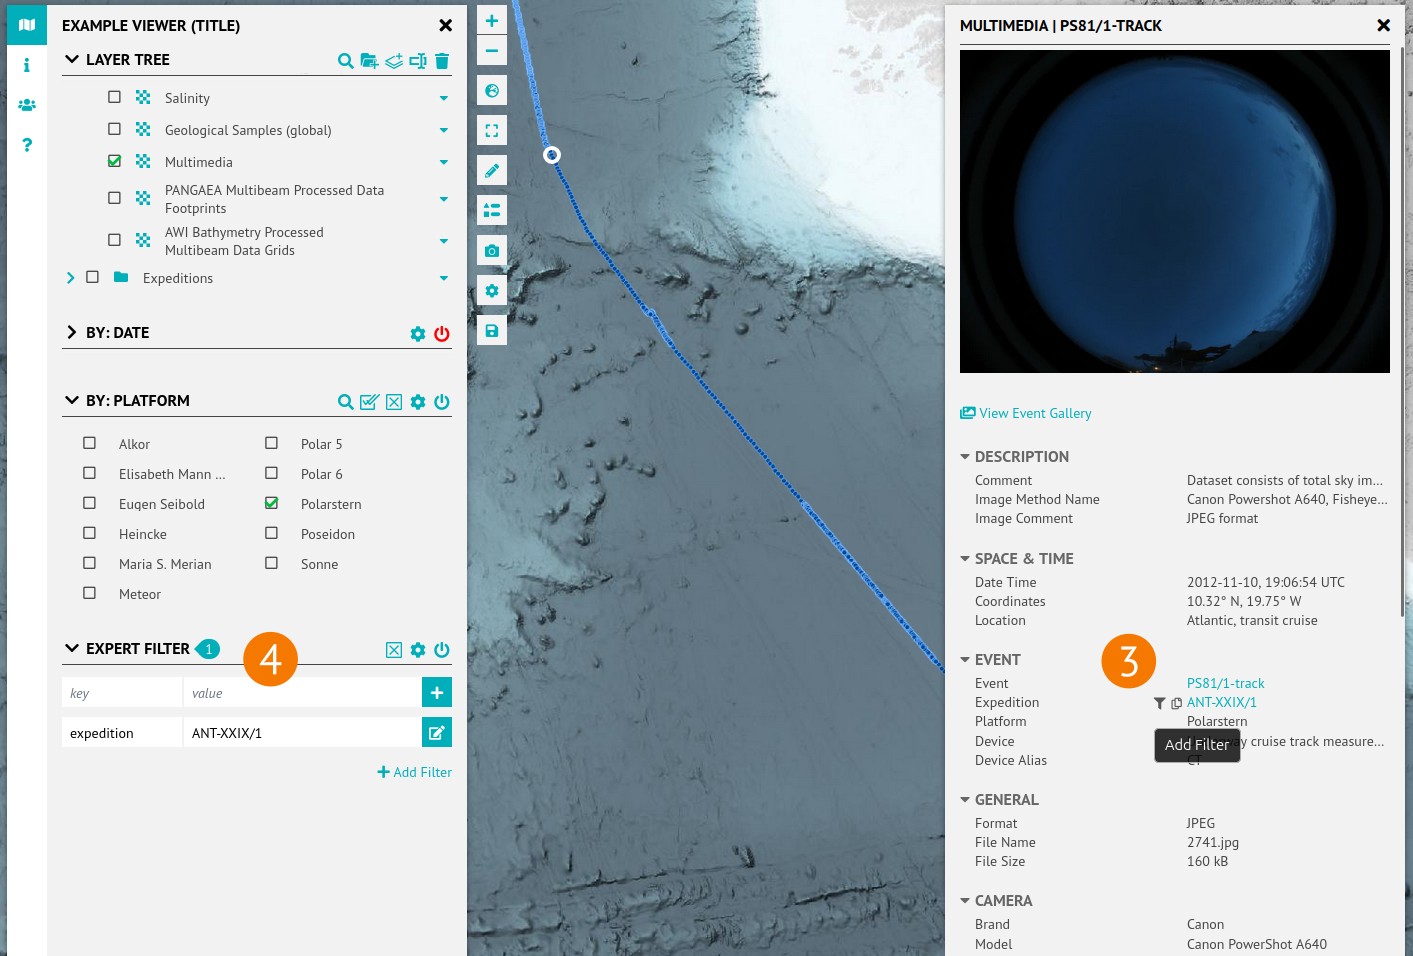
Clicking content on the map (1) in most cases opens a popup showing some information (2). Clicking Show more opens the right sidebar usually containing more information (3).
The right sidebar offers a bunch of interactions. Some are basic, but one of the more sophisticated features is directly putting a key-value pair with one click on the on-hover filter button (3, funnel icon) directly to a filter widget (4).